Tesla (TSLA) Chart and Technical Snapshot
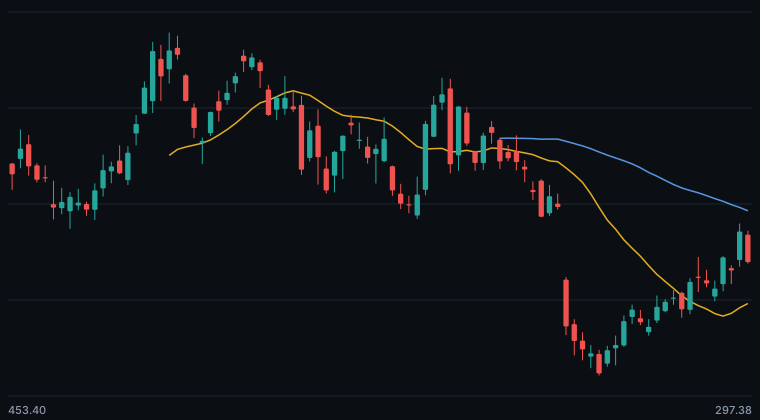
electric vehicles and energy — daily chart with 20-day and 60-day moving averages.
Technical Snapshot
Technical Snapshot: TSLA closed at 348.75 on the latest daily bar (change -1.71%). Price is above both the 20-day (338.82) and below 60-day (367.30) averages. MACD DIF is above DEA. RSI-14 at 59 (firm zone). The price sits at 40% of its 60-bar range. Volume ~1.0x the 20-day average (normal).
Reference Levels
| Metric | Value |
|---|---|
| Recent reference support | 301.33 |
| Recent reference resistance | 351.62 |
| 60-bar range low / high | 297.38 / 441.07 |
| MA5 / MA10 / MA20 / MA60 | 348.99 / 342.68 / 330.13 / 372.29 |
Read It Yourself
Open TSLA in the interactive AI24X Markets charting workbench — add indicators, switch periods, and get the AI technical-health brief.
Explore TSLA freeMore Charts
NVDA · AAPL · MSFT · AMZN · META · GOOGL · AMD · PLTR · NFLX · AVGO · COST · CRM · ORCL · UBER · ABNB · PYPL · SHOP · SNOW · COIN · JPM · V · LLY · JNJ · PFE · XOM · BA · CAT · NKE · DIS · All guides
This content is for educational purposes only and is not investment advice. Market data is delayed at least 15 minutes.