Russell 2000 ETF vs S&P 500 ETF
small caps vs large caps — normalized 100-index comparison of the last 90 daily bars.
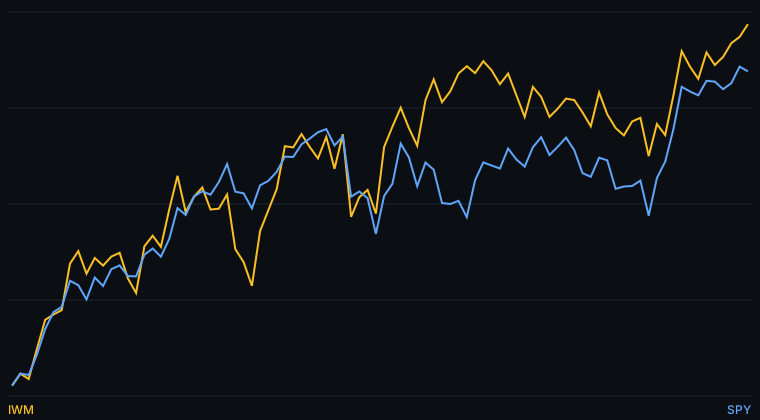
3.76%IWM 20-bar change
4.45%SPY 20-bar change
12.03%IWM 60-bar change
6.08%SPY 60-bar change
Comparison Snapshot
Over the last 20 bars, IWM changed 3.76% and SPY changed 4.45%; over 60 bars, IWM changed 12.03% and SPY changed 6.08%. IWM sits at 100% of its 60-bar range and SPY at 97%. IWM: RSI-14 at 63 (firm zone). SPY: RSI-14 at 66 (firm zone).
Over the measured window, SPY recorded the higher 20-bar change and IWM the higher 60-bar change. Past performance is not a prediction of future results.
Compare Them Yourself
Open both tickers side by side in the interactive workbench and apply moving averages, MACD and RSI.
Open IWM in chartsMore Guides
This content is for educational purposes only and is not investment advice. Market data is delayed at least 15 minutes.